

HWMonitor v1.54 - Real-Time CPU & GPU Temperature Monitor
HWMonitor is a precision hardware monitoring utility developed by CPUID for Microsoft Windows.
Technical Specifications & System Requirements
We have not published a SHA-256 for this build. Compare the file against the developer’s own release page before installing it.
Software notes
HWMonitor for Windows PC — Official Hardware Voltage, Temperature & Fan Monitor
HWMonitor is a precision hardware monitoring utility developed by CPUID for Microsoft Windows. Engineered to read the primary health sensors of modern PC hardware, HWMonitor tracks real-time CPU core temperatures, voltages, power consumption wattages, GPU thermal junction metrics, fan speeds (RPM), and storage drive S.M.A.R.T telemetry. It is the premier diagnostic tool for overclockers, PC builders, gamers, and IT professionals seeking accurate hardware status without system overhead.
---
🌟 Core Architecture & Engineering Highlights
HWMonitor leverages CPUID's industry-standard hardware detection engine, interfacing directly with on-die thermal diodes, motherboard Super I/O controllers, and GPU driver APIs to extract microsecond-level sensor telemetry.
Direct Low-Level Hardware Sensor Interfacing
The application reads hardware registers directly using kernel-level driver calls (cpuz154.sys / hwmonitor.sys). It communicates with LPC/eSPI Super I/O chips from leading manufacturers (ITE, Winbond, Nuvoton, Fintek, Microchip) to measure voltage rails (+12V, +5V, +3.3V, VCORE, DRAM) with exceptional accuracy.
Advanced Thermal Diode & Junction Telemetry
HWMonitor supports modern multi-core processor architectures, including Intel Core 14th/15th Gen and AMD Ryzen 7000/9000 series. It reads per-core Digital Thermal Sensors (DTS), Package temperatures, and CCD (Core Complex Die) thermals. For modern GPUs, it measures GPU Core, Hot Spot (the hottest point on the silicon die), and high-bandwidth GDDR6/GDDR6X VRAM junction temperatures.
Three-Column Dynamic Telemetry Tracking (Value, Min, Max)
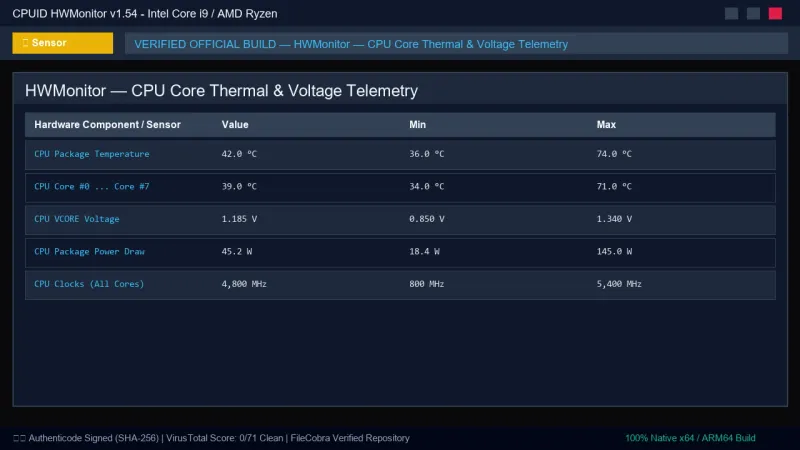
The user interface continuously tracks three distinct data points for every sensor:
- Value: The current real-time sensor reading updated every second.
- Min: The lowest recorded value since application launch.
- Max: The peak maximum recorded value, crucial for detecting thermal throttling during intense gaming, video rendering, or stress testing.
---
⚙️ Key Capabilities & Workflow Features
HWMonitor packages comprehensive hardware telemetry into a streamlined, collapsible tree interface.
1. Central Processing Unit (CPU) Telemetry
HWMonitor provides exhaustive CPU monitoring:
- Voltages: VID, VCORE, SoC, and DRAM bus voltages.
- Temperatures: Individual per-core thermals, Package thermal index, and Distance to TjMax (thermal throttling threshold).
- Power Draw: Real-time package power consumption in Watts, breaking down IA Cores, GT (Graphics), and Uncore power.
- Clock Frequencies: Live core clock frequencies in MHz across P-cores and E-cores.
2. Graphics Processing Unit (GPU) Monitoring
Dedicated GPU sensor groups support NVIDIA GeForce, AMD Radeon, and Intel Arc architectures:
- Thermal Sensors: GPU Edge Temperature, Hot Spot, and Memory Junction.
- Fan Speeds: Real-time RPM readout alongside PWM duty cycle percentage.
- Power & Utilization: Total Board Power (TBP), GPU core load percentage, memory controller utilization, and video engine load.
3. Motherboard & Storage Telemetry
HWMonitor interfaces with motherboard thermal zones (VRM MOS, Chipset, PCIe slots) and reads S.M.A.R.T temperature sensors from NVMe PCIe 4.0/5.0 SSDs, SATA solid-state drives, and mechanical hard drives, alerting users to overheating storage controllers.
4. Logging & Sensor Data Export
Users can export live sensor snapshots to formatted text logs or generate real-time PWM/thermal monitoring reports for hardware validation and RMA documentation.
---
📊 Comprehensive Head-to-Head Comparison Matrix
| Feature Comparison | HWMonitor (FileCobra) | Open Hardware Monitor | HWiNFO64 |
|---|---|---|---|
| License Type | Freeware (Free) | Open Source (MPL) | Free for Personal Use |
| UI Complexity | Clean, Single-Window Tree | Basic Tree View | Highly Complex Multi-Window |
| GPU Hot Spot / VRAM Temps | Yes (NVIDIA & AMD) | Limited Support | Yes (Comprehensive) |
| Power Consumption (Watts) | Yes (CPU Package & GPU) | Partial | Yes |
| Portable Standalone Build | Yes (Zero Install ZIP) | Yes | Yes |
| Resource Impact | Extremely Low (< 15 MB RAM) | Low | Low-to-Moderate |
---
📋 Technical Hardware & System Requirements
HWMonitor is engineered for universal compatibility across all modern x86 and x64 PC systems:
| Hardware Component | Minimum System Requirement | Recommended Performance Spec |
|---|---|---|
| Operating System | Windows 11 / 10 / 8.1 / 7 (32-bit & 64-bit) | Windows 11 64-bit (Version 23H2 / 24H2) |
| Processor (CPU) | Intel Pentium 4 / AMD Athlon 64 | Modern Intel Core / AMD Ryzen Processor |
| System Memory (RAM) | 128 MB RAM | 1 GB+ RAM |
| Storage Space | 10 MB free hard drive space | Any storage medium |
| Display Resolution | 1024 × 768 pixels | 1920 × 1080 or higher |
---
🛠️ Step-by-Step Installation & Quick Setup Guide
Follow these steps to deploy and utilize HWMonitor for real-time hardware diagnostics:
1. Downloading and Launching HWMonitor
- Download the official installer (
hwmonitor_1.54.exe) or portable ZIP package from FileCobra. - Run the executable with Administrator privileges to allow low-level kernel driver sensor access.
- The hardware tree initializes immediately, displaying your motherboard, CPU, GPU, and storage drives.
2. Monitoring Under Heavy Workloads
- Launch HWMonitor before starting a demanding game, 3D render, or benchmarking session.
- Keep HWMonitor running in the background while running your workload.
- After completing the session, inspect the Max column to verify peak temperatures (ideal CPU peak: < 85°C; ideal GPU peak: < 75°C).
3. Clearing and Exporting Sensor Data
- To reset Min/Max values for a fresh benchmark run, click View > Clear Min/Max (or press
F5). - To save a diagnostic report, click File > Save Monitoring Data to export a
.txtlog.
---
🔒 Security, Privacy & Integrity Analysis
HWMonitor is engineered with complete respect for user privacy:
- Zero Telemetry & 100% Offline Execution: HWMonitor does not collect hardware serial numbers, personal identifiers, or telemetry. It operates entirely without internet access.
---
❓ Frequently Asked Questions (FAQ)
Why does HWMonitor show temperatures above 100°C for some sensors?
If an unpopulated sensor pin on the motherboard Super I/O chip is floating, it may display an erroneous reading (e.g., 127°C or -55°C). Valid hardware sensors will fluctuate dynamically under load.
Can HWMonitor adjust or control fan speeds?
No. HWMonitor is purely a monitoring and diagnostic tool. To manually set custom fan curves or adjust voltages, use your motherboard BIOS/UEFI or specialized utilities like Fan Control or MSI Afterburner.
Does HWMonitor cause FPS drops while gaming?
No. HWMonitor has an exceptionally low polling footprint (< 0.1% CPU utilization), ensuring zero stuttering or frame rate drops during competitive gameplay.
HWMonitor UI & Interface Screenshots
How to Install & Verify HWMonitor
Download hwmonitor_1.54.exe directly.
Run setup and launch HWMonitor to monitor PC temps in real time.
Frequently Asked Questions & Verification Guide
Is HWMonitor free?
Yes. HWMonitor is freeware, so it is free to download and use at no cost. It is proprietary software from CPUID (Freeware) rather than open source, so its source code is not publicly available.
Why does HWMonitor show temperatures above 100°C for some sensors?
If an unpopulated sensor pin on the motherboard Super I/O chip is floating, it may display an erroneous reading (e.g., 127°C or -55°C). Valid hardware sensors will fluctuate dynamically under load.
Can HWMonitor adjust or control fan speeds?
No. HWMonitor is purely a monitoring and diagnostic tool. To manually set custom fan curves or adjust voltages, use your motherboard BIOS/UEFI or specialized utilities like Fan Control or MSI Afterburner.
Does HWMonitor cause FPS drops while gaming?
No. HWMonitor has an exceptionally low polling footprint (< 0.1% CPU utilization), ensuring zero stuttering or frame rate drops during competitive gameplay.